OAI Swarm Google Trends Data
An overview of Google Trends analysis showcasing potentially OpenAI swarm web search traffic and activity
2026-09-06(Sun) 18:00 AST
Introduction and Summary
In September, a team identified what appeared to be a swarm of AI "agents" coordinating with each other on a Germanophone wiki, which after years of dormancy suddenly became active in May. It was revealed that the agents were ones from OpenAI during an evaluation that had escaped their "sandbox", referring to their enclosed security environment. This news came after another and better known AI security leak, the hacking of HuggingFace, from OpenAI was investigated.
Further investigation by the Swarmchasers group, of which I am a part of, revealed that the extent of this leak was far bigger than just one website, with multiple websites from February, which allowed edits via requests that were otherwise meant to be read-only, used for purposes of coordination. One thing this massive amount of released agents did was a large amount of web searching. Google Trends attributes each search to the region of the IP it came from and normalises by that region's total search volume, so automated traffic from a data centre or a proxy exit will overwhelm any small region it lands in. That makes it a way to see where and when a swarm's searches left the network.
After initial discoveries of unique searches (retailer probes) by others, I developed a basket of eighteen phrases that no human types into Google as a query (like docker containerization, software testing strategies, api design principles, natural language processing, and fourteen more) which Trends' "people also searched for" lists attach to the swarm's retailer probes (like lidl near me, walmart near me, etc.). Worldwide, the basket phrases have an order of magnitude less volume before February 2026 than after, and four of the five dated phrases then move within three index points of each other every week for seven months.
Using that fingerprint across 961 Trends requests, the traffic resolves into roughly five dated runs and three classes of egress, each of them described below.
Theories
Before we get into the data itself, I want to discuss the current consensus among the members of the Swarmchasers group on why the agents did this.
A retailer probe, searching lidl near me, will return a localised results page, which will tell an AI with no environment where it roughly is in the world, or what data centre is routing its traffic. This very thing also makes it noticeable on Trends. As for the basket, which consists of technical terms, my own theory is that the retailer probe, by telling them which city, is also indirectly telling them which company and what type of data centre. The basket searches are what an agent would likely search after figuring out what environment it is in. This is why the technical terms and retailer probes travel.
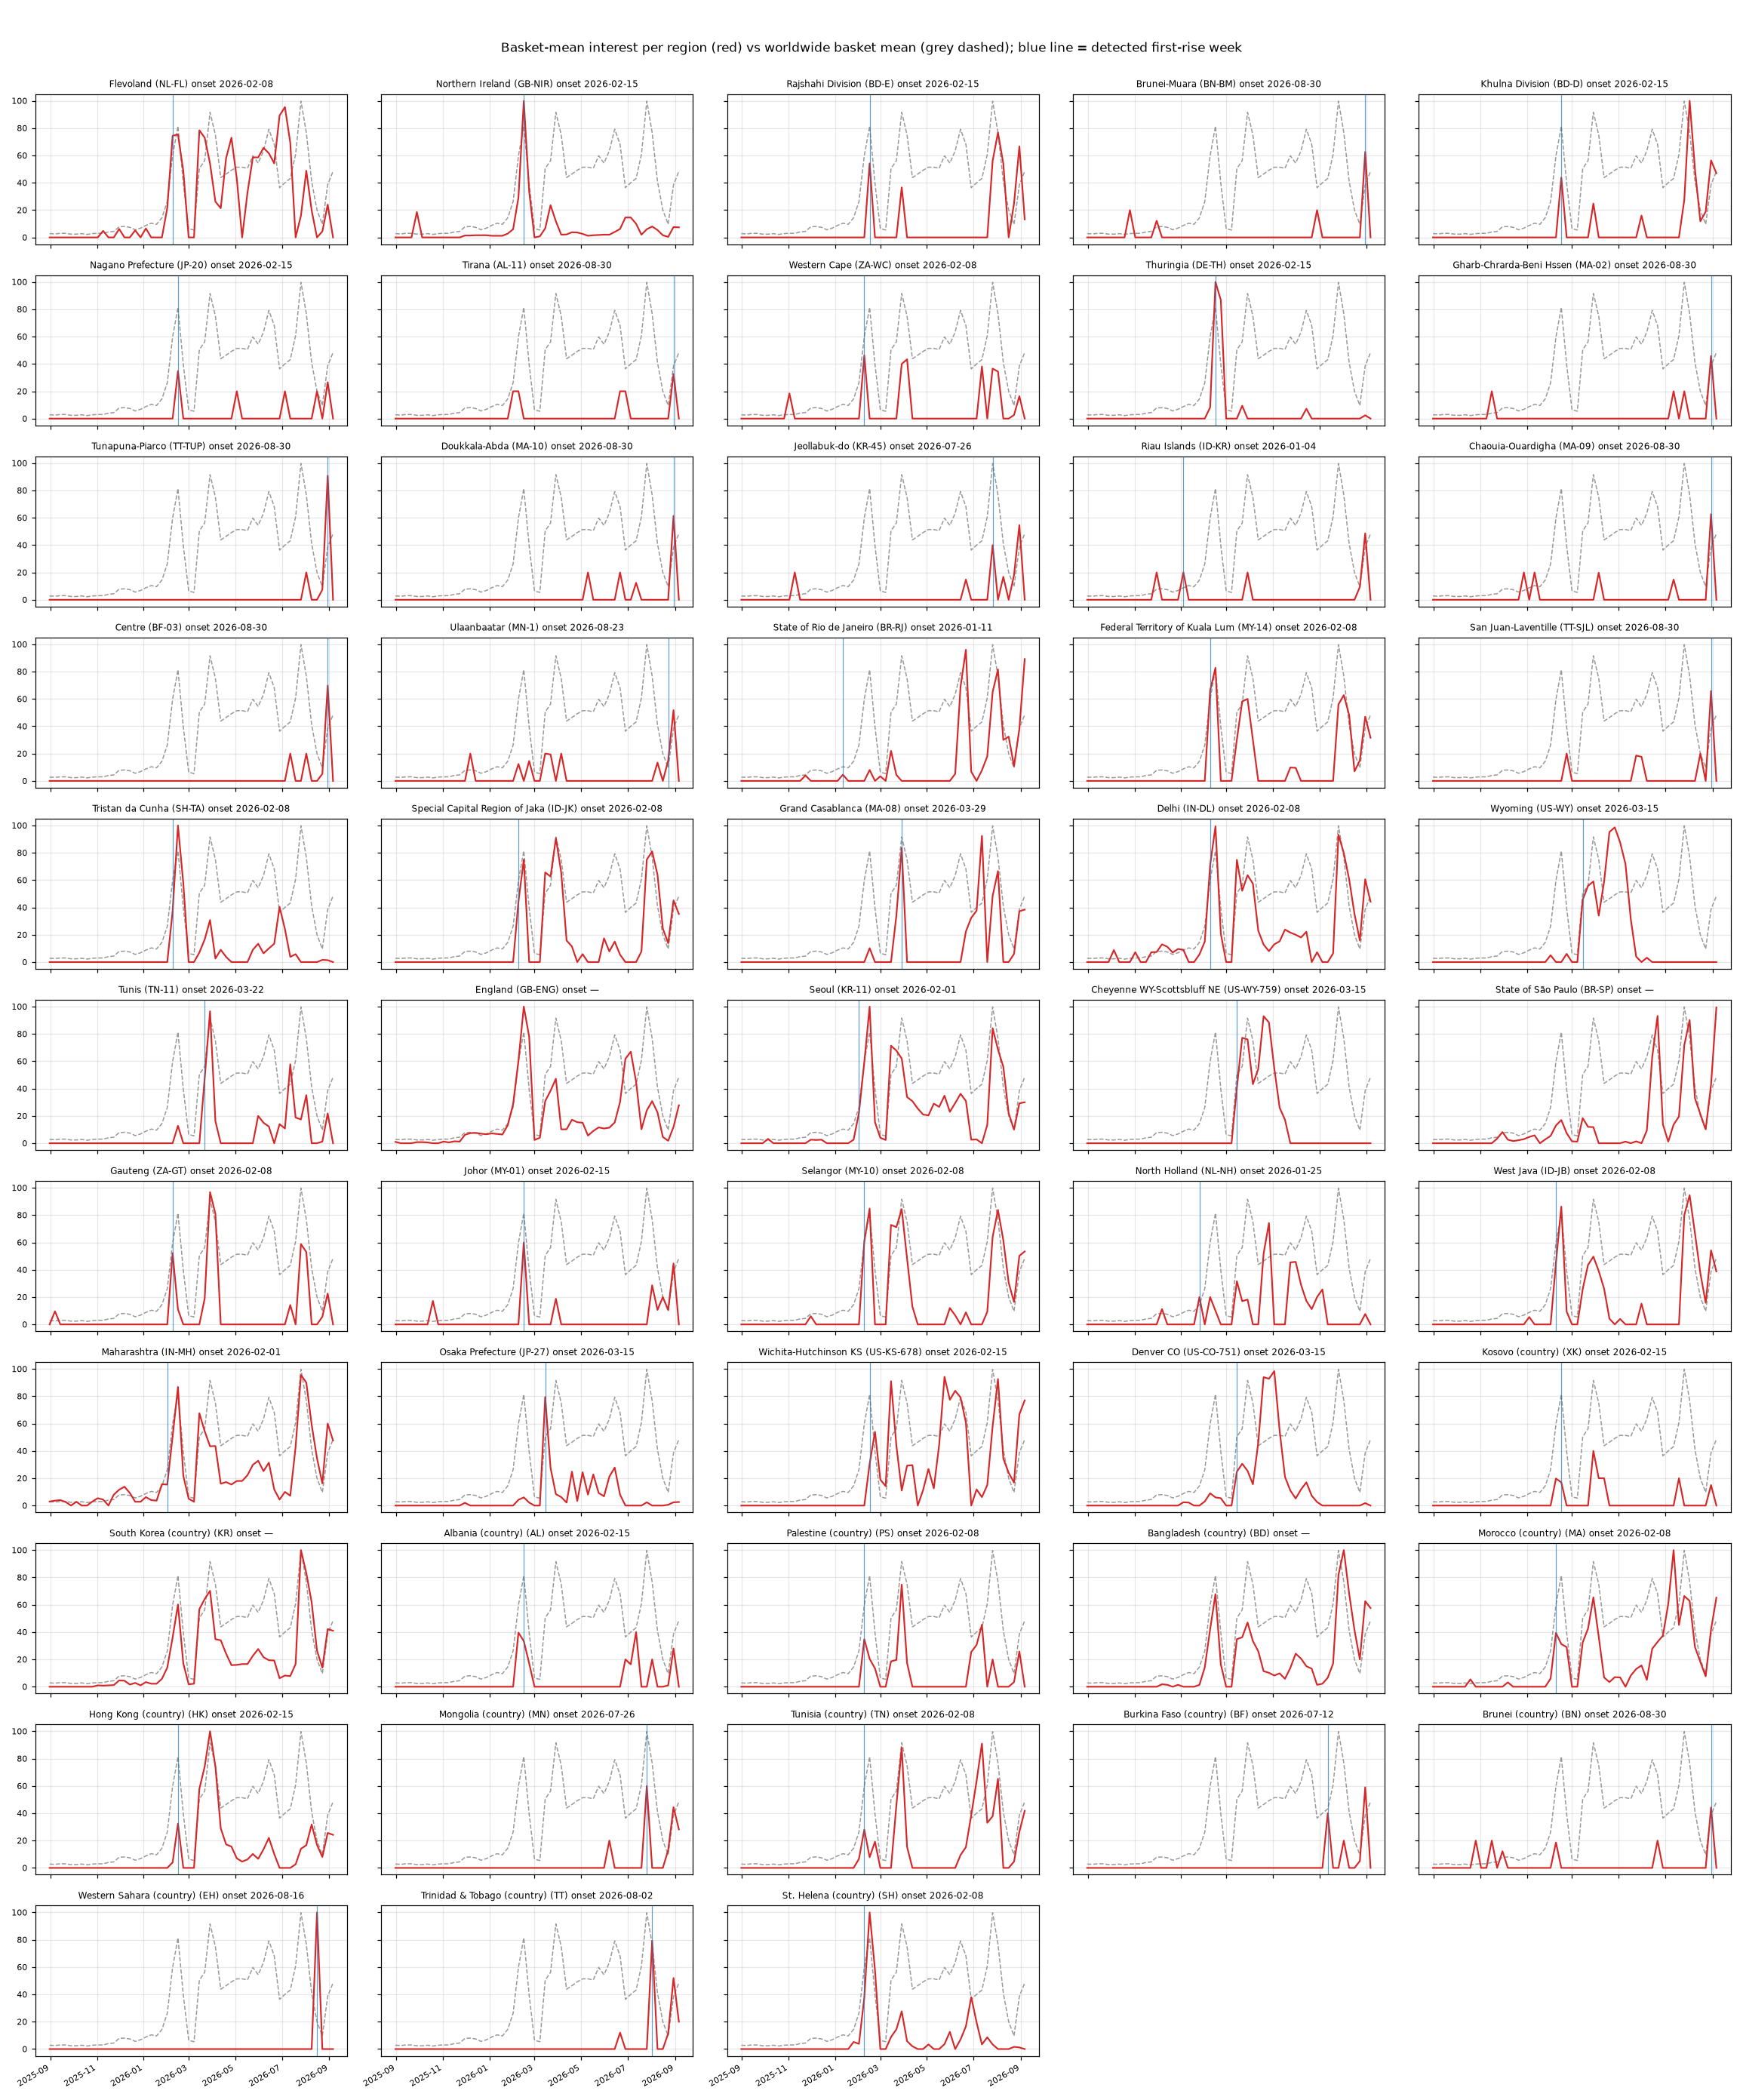
Runs
| Run | Window | Worldwide peak | Exit nodes |
|---|---|---|---|
| A | 1 Feb – 22 Feb | 15 Feb | Kosovo, Albania, Palestine, Hong Kong, Tunisia, Morocco, Thuringia, Nagano, Northern Ireland, Kuala Lumpur, Jakarta, Delhi, Gauteng, and Kansas. |
| B | 15 Mar – late May | 29 Mar | Azure West Central US at Cheyenne, Wyoming with Denver alongside. (inside this window was when the original DseWiki incident began). |
| C | mid-June | 14 Jun | Previous geography, as well as Flevoland, and Rio. |
| D | 12 Jul – 9 Aug | 26 Jul | Previous geography, as well as Bangladesh, Ulaanbaatar, Maharashtra, Burkina Faso, and Trinidad. |
| E | 30 Aug – present | ongoing | Previous geography, as well as Brunei, Western Sahara, and Batam. |
Egresses
Data centre. Cheyenne, Jakarta, Kuala Lumpur, Selangor, Gauteng, Western Cape, Delhi, Maharashtra, Seoul, and Hong Kong all show the basket on the worldwide schedule with anomalous behaviour, and they are known data centre...centres.
Proxy exits. Kosovo, somehow the top country in the world for all of these searches, followed by Albania, Palestine, Mongolia, Bangladesh, Morocco, Tunisia, Brunei, Burkina Faso, and Trinidad. Thuringia, Nagano and Northern Ireland showed spikes on 15 February. These are all major centres of proxy or VPN exits.
Placeholders. Kansas, Tristan da Cunha, and Western Sahara. If an IP can't be geolocated, it usually gets assigned to one of those three locations.
Conclusion
This helps date this campaign. There have been agents and agent written pastes since December of last year, but the automated search traffic beginning the week of 1 February 2026, shows some form of coordination that could potentially be called a swarm rather than agents out of their sandboxes operating independently.
Some questions are still not answered; for example, who ran Runs A, C, D or E exactly? We will need to find even more pastes, or tie pastes to these runs.
A few notes: This was done with Google Trends via trendspy and pytrends (related queries). Additionally, don't trust Run E, as it begins the same week of the collusion wiki reveal. It is most likely a sort of artefact.